

The Setup for Much Higher Gold
Short-term volatility hit hard this week, but the long-term case for gold and the miners keeps strengthening.


Quote of the Week
“I can’t predict the future to 100%. I never said that I could, but I am a strict student of visible data and historical cycles. And I’m telling you, all of the visible data, all the historical cycles tell us that this move is nowhere near over, and it would not be out of line with the historical averages for gold to get above $20,000.” - Christopher Aaron
Our take: The data doesn’t lie, and the historical playbook for monetary crises is clear. When debt spirals, currencies debase, and confidence in the financial system erodes, gold doesn’t just rally, it explodes. We’ve seen this pattern before in the ‘70s, and the current setup has all the same ingredients but at a larger scale. $20,000 appears extreme until you compare it with previous bull-market endpoints relative to debt levels and money-supply growth. The cycle isn’t done. It’s just getting started.
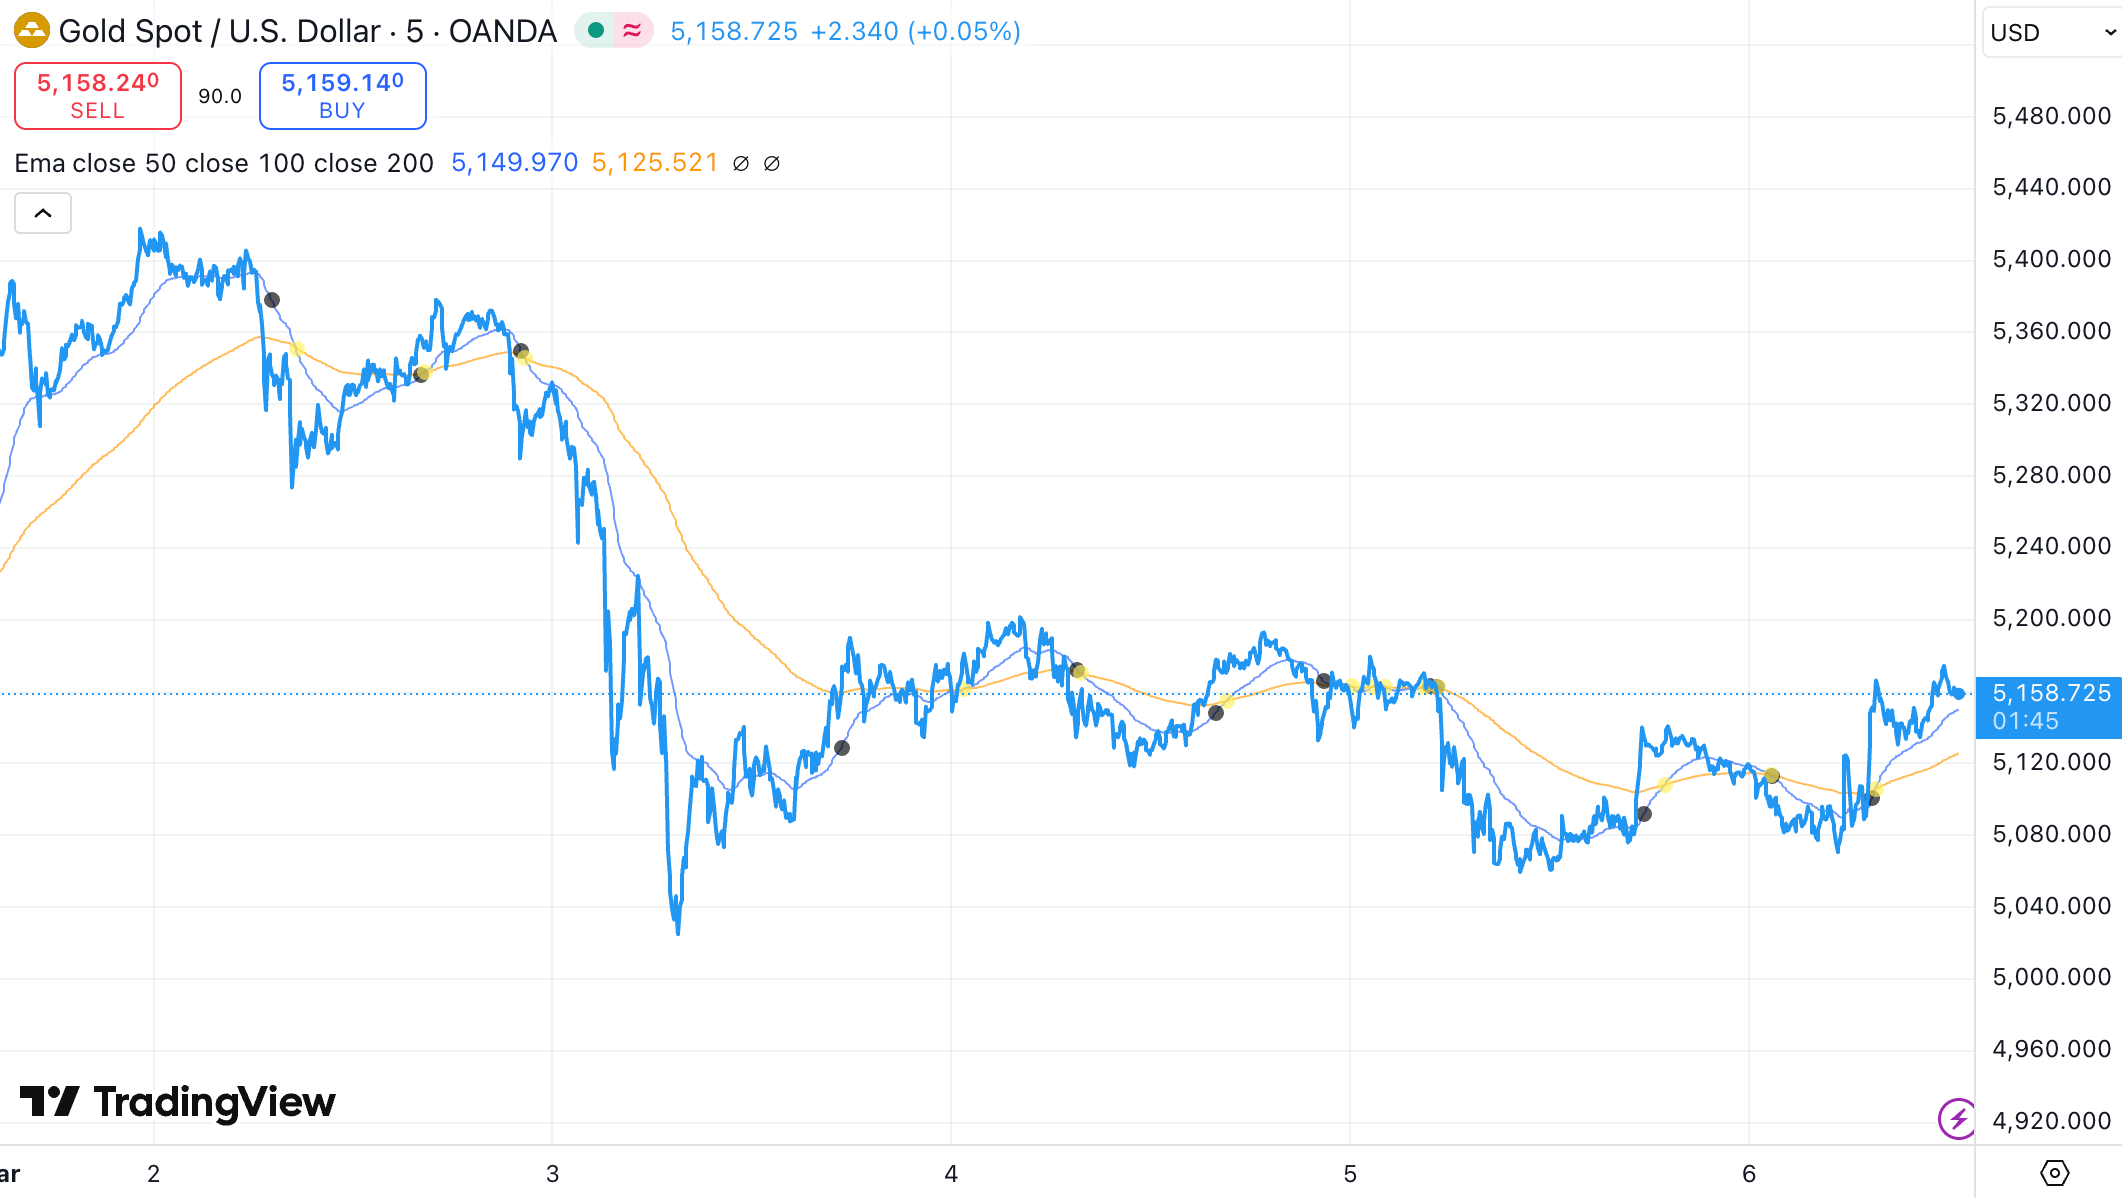
Chart of the Week
Gold came into the week around $5,408 but sold off hard, with spot gold dropping roughly $177 in a single session by March 3. The pullback was driven by a combination of profit taking after hitting record highs, a stronger U.S. dollar, and a technical correction after prices had pushed above $5,300. Essentially, the metal ran too far too fast and got hit by sellers cashing out.
The bounce came mid-week, with spot gold recovering 1.6% on Wednesday after falling more than 4% on Tuesday, supported by a dollar pullback and escalating conflict in the Middle East, driving safe-haven demand. As Peter Grant at Zaner Metals noted, as long as the Iran war is ongoing, that geopolitical risk premium is going to stay in the price. So in short: dollar strength and profit-taking knocked it down, geopolitical fear bought it back up.
“Gain” of the Week
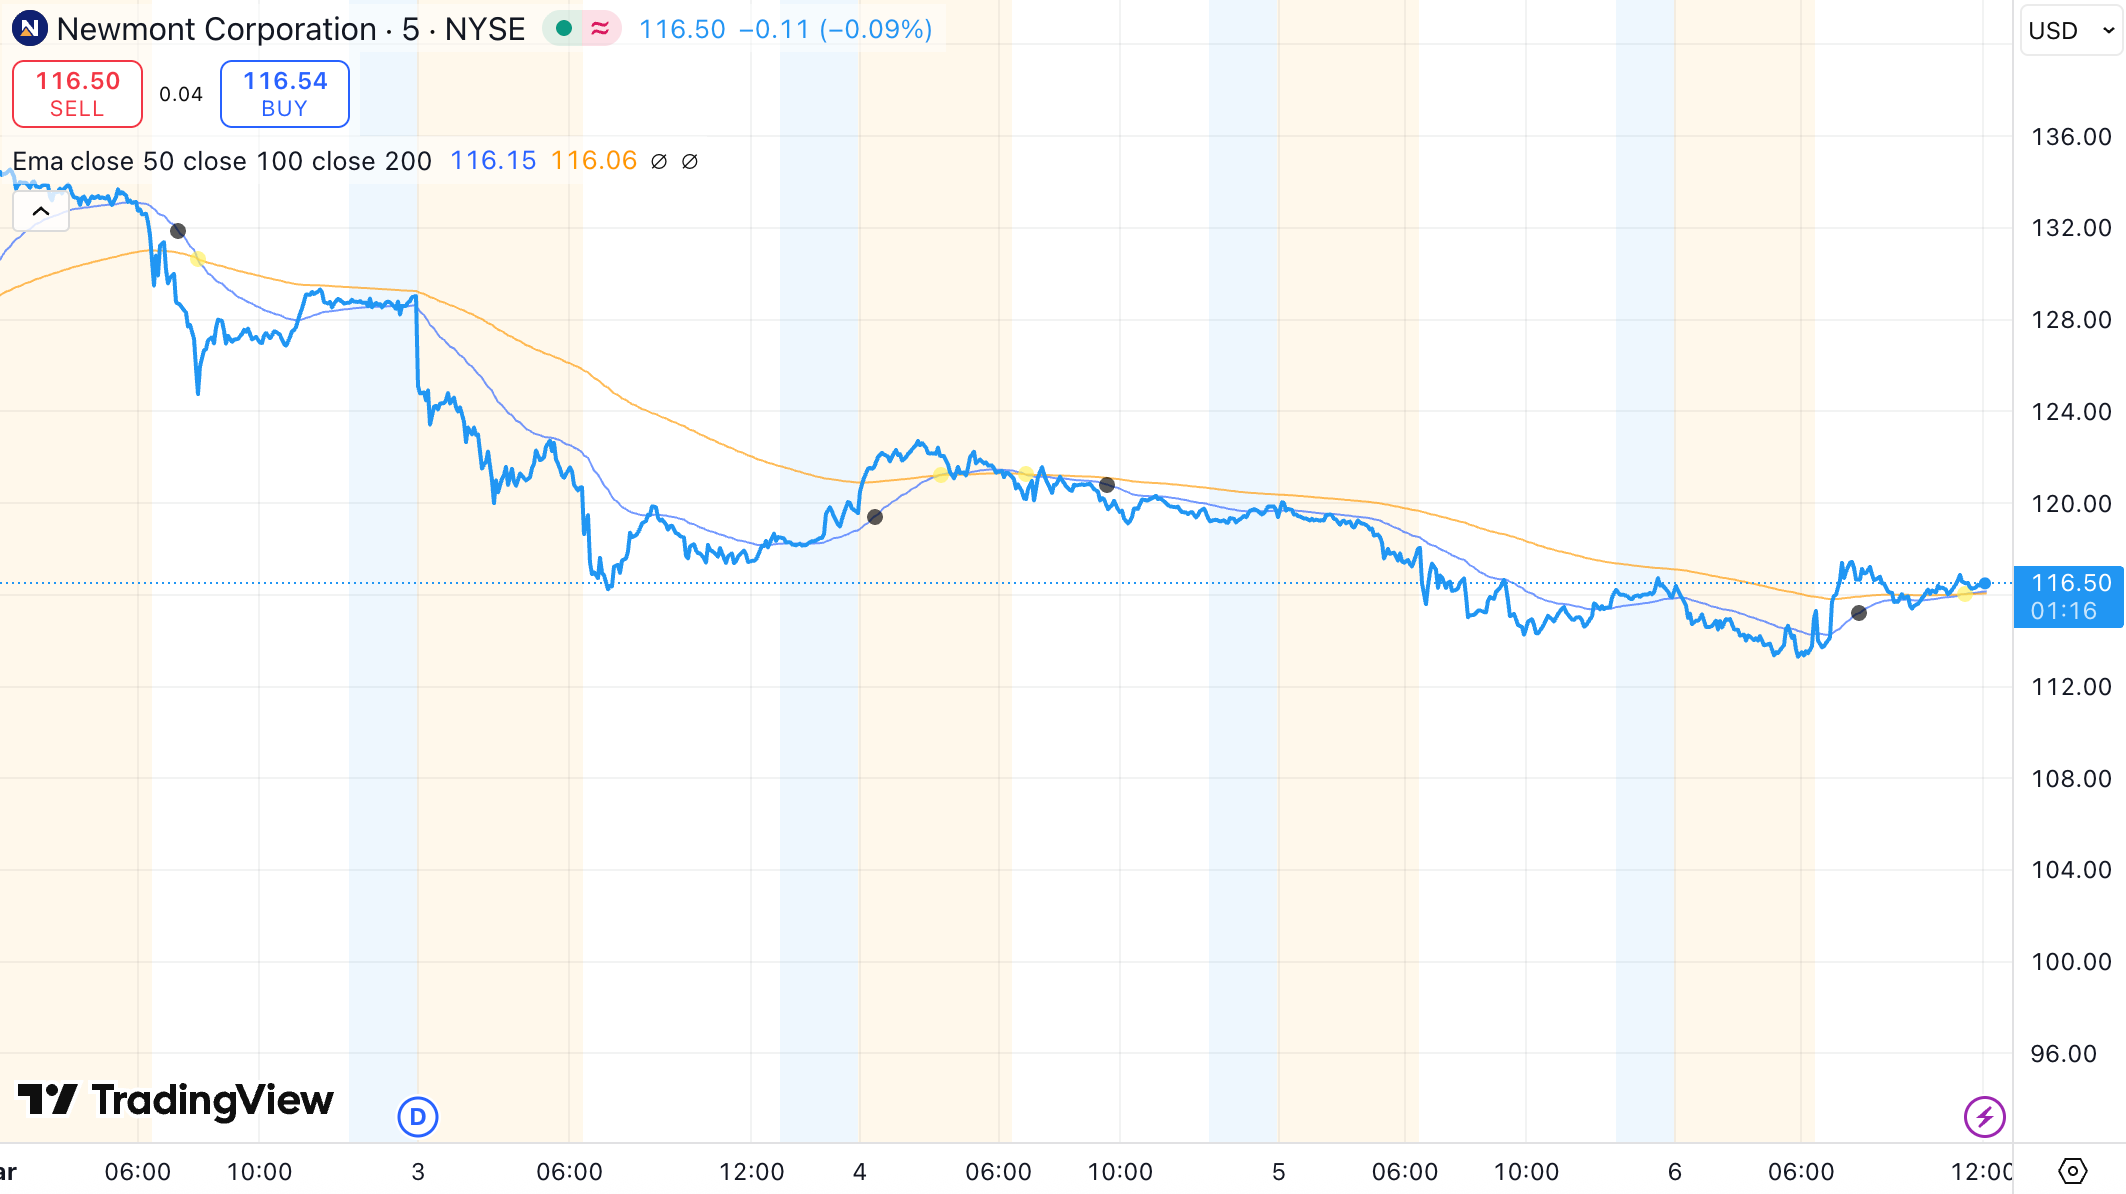
Newmont is down roughly 12% this week, pulling back alongside gold’s consolidation after touching all-time highs. But here’s the context: on Friday, March 6th, Zacks Investment Research upgraded Newmont to a Zacks Rank #1 (Strong Buy), driven by analysts scrambling to raise earnings estimates. Citigroup and Bank of America have targets in the $150–$151 range, while Bernstein set a street-high target of $157 on March 1st.
Much of this week’s dip is technical. Newmont went ex-dividend on March 3rd ($0.26/share), triggering mechanical selling. Add broader market volatility, and you get a 12% pullback that has nothing to do with the bull case.
The fundamentals are explosive. At $5,000+ gold, Newmont’s All-In Sustaining Cost is projected at $1,680/oz for 2026. If they sell at $5,100, they pocket $3,420 profit per ounce. On 5.3 million ounces of production, that’s roughly $18 billion in free cash flow potential. Newmont has reached a net cash position of over $2 billion after eliminating debt, and they still have $2.4 billion remaining in their $6 billion share buyback authorization. At current prices, management is likely aggressively buying back stock.
COO Natascha Viljoen labelled 2026 a “planned production trough,” meaning the market has already priced in lower production. Any operational beat is a massive upside surprise. Newmont also holds 13.5 million tonnes of copper reserves, and with copper near $5.76/lb, the company is increasingly being viewed as an energy transition play, not just a precious metals producer.
Bottom line: Newmont is down 12% on technical selling and ex-dividend mechanics, not a change in thesis. With $18 billion in potential free cash flow at $5,000 gold, a fortress balance sheet, and $2.4 billion in buyback firepower, this pullback looks like an opportunity. The bull case just got an upgrade.
Want more weekly insights like this? Subscribe and stay tuned for next week’s edition of the VRIC Media Newsletter.
Disclaimer: This content is for educational purposes only and is not financial advice. Do your own research and consider speaking with a licensed professional.