

Compression Creates Expansion
Price rests. Pressure builds. Breakouts follow.


Do you want to hear Don break down the gold and silver markets live, and analyze some of your favourite companies? Sign up for Commodity University. Once you’re inside, you’ll get access to our live mastermind on November 18th. You don’t want to miss this. Link HERE.
Quote of the week
“I actually think that August was the beginning of this breakout we’ve been waiting for. It ran too hard, too fast, from $3,300 to almost $4,400… but it showed you how much demand there is for gold, and that it’s not going away. Now we’re consolidating around $4,000... November is historically one of the best months for stocks, and gold’s been correlated with the S&P. I think this 10% correction in gold is over in the short term.”
Our take: Gold’s run from $3,300 to nearly $4,400 was explosive, but the demand signal was clear. Now consolidating around $4,000, the technical setup is improving heading into November. The 10% correction created the entry point. The play: Position in physical gold and quality producers while the market digests the move. The demand isn’t going away.
Chart of the week
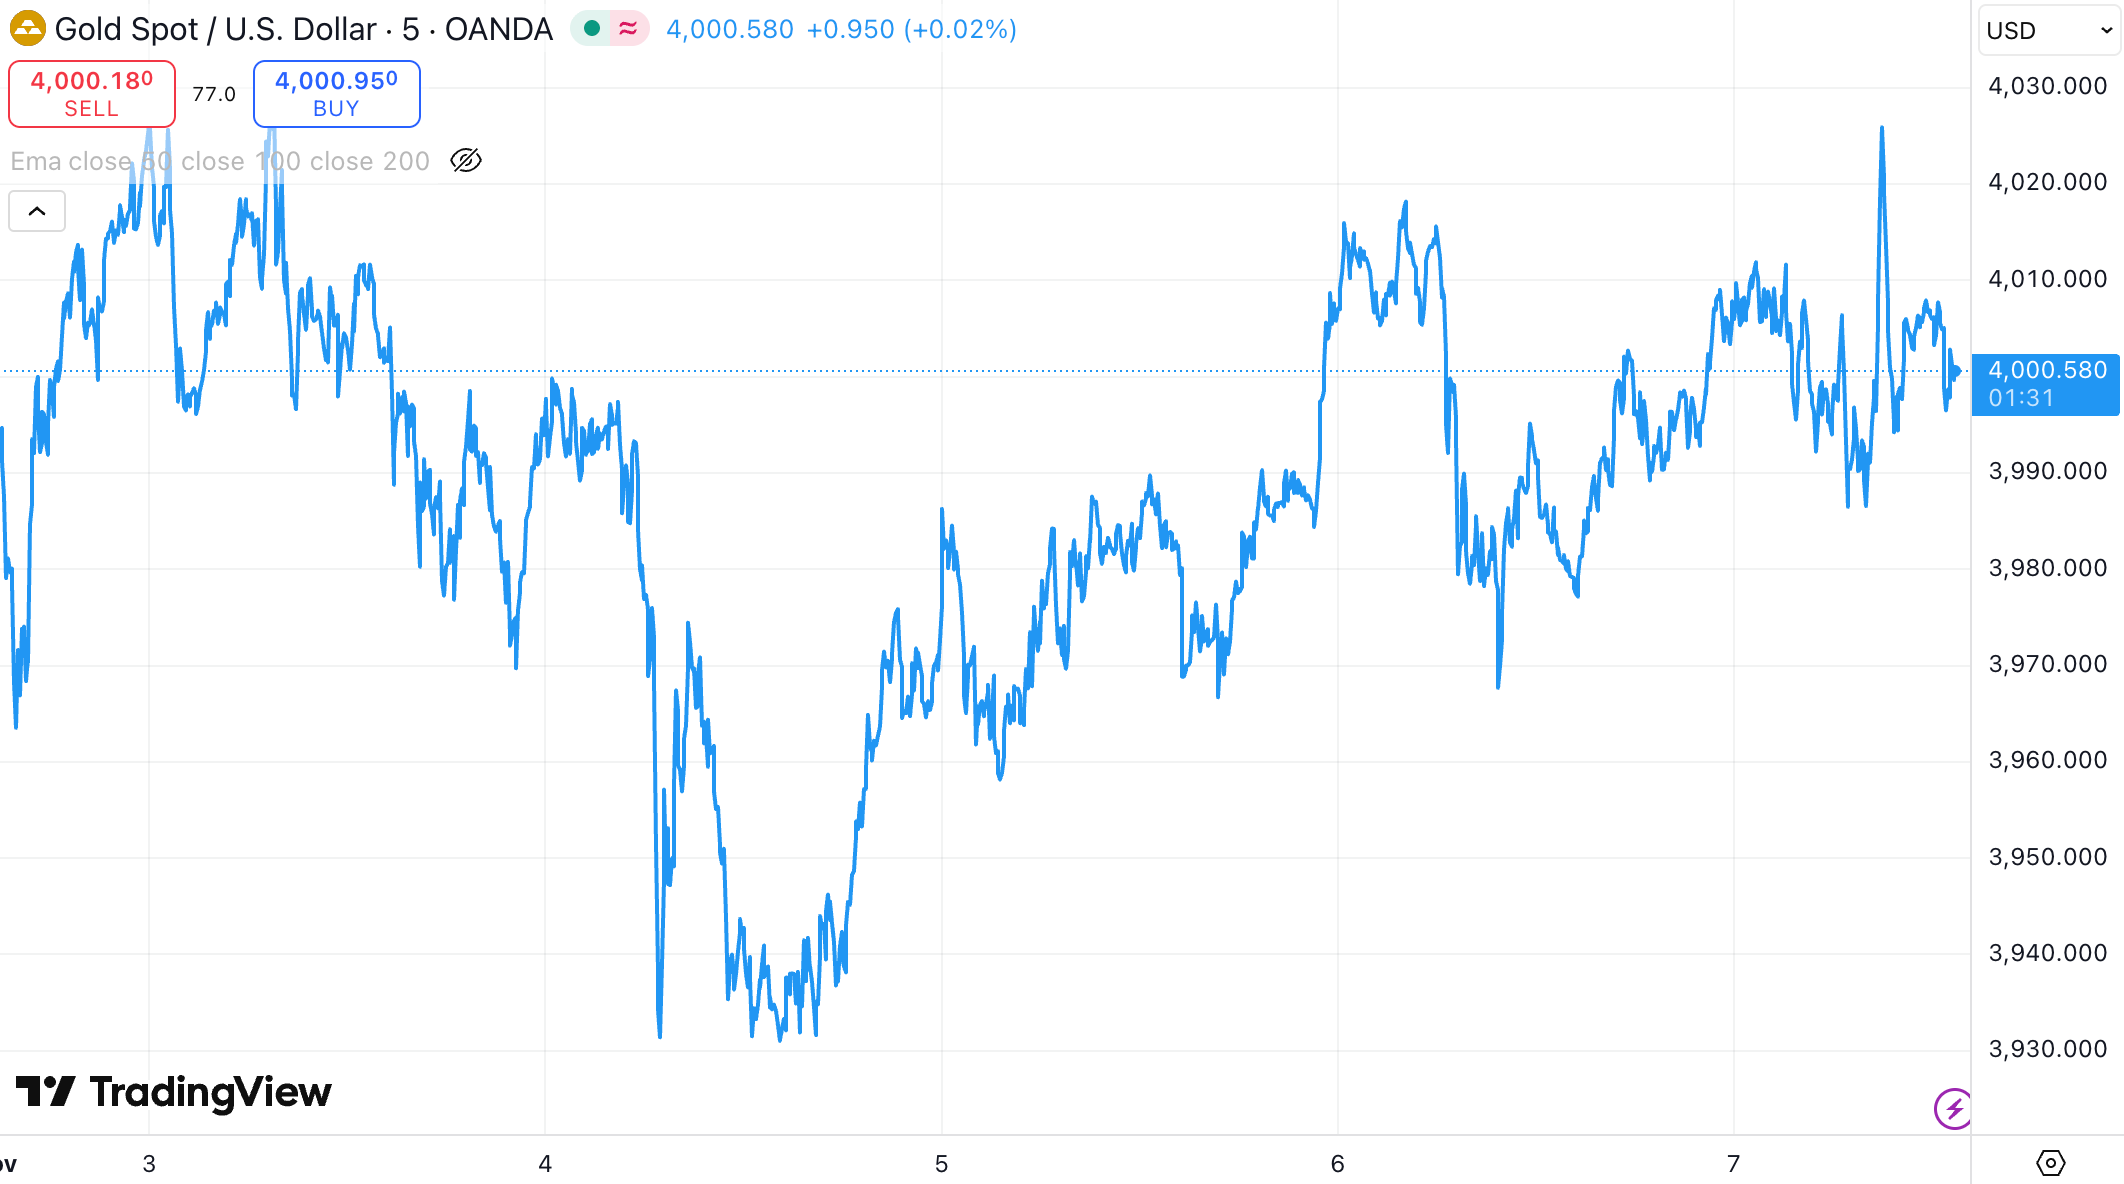
This week, gold stabilized around $4,000 per ounce after a sharp correction from October’s record highs near $4,381. The pullback was driven by technical profit-taking following a 47% year-to-date rally and a stronger US Dollar Index climbing toward 100, which typically pressures gold. Robust US economic data, particularly strong private sector job growth, reinforced expectations that the Federal Reserve will maintain its “higher for longer” stance, increasing the opportunity cost of holding gold.
However, gold rebounded to approximately $4,000, supported by signs of slowing contraction in the US services sector and ongoing geopolitical uncertainties driving safe-haven demand. Technically, gold is trading in a neutral zone with key support around $3,970 to $3,900 and resistance near $4,040 to $4,090. Technical indicators like the RSI and MACD show a pause in downward momentum, while price action forms a consolidation triangle that could break in either direction. Important near-term catalysts include Federal Reserve policy updates, US Dollar movements, central bank gold purchases, and geopolitical risk factors, which continue to underpin gold’s safe-haven appeal.
Gain of the week
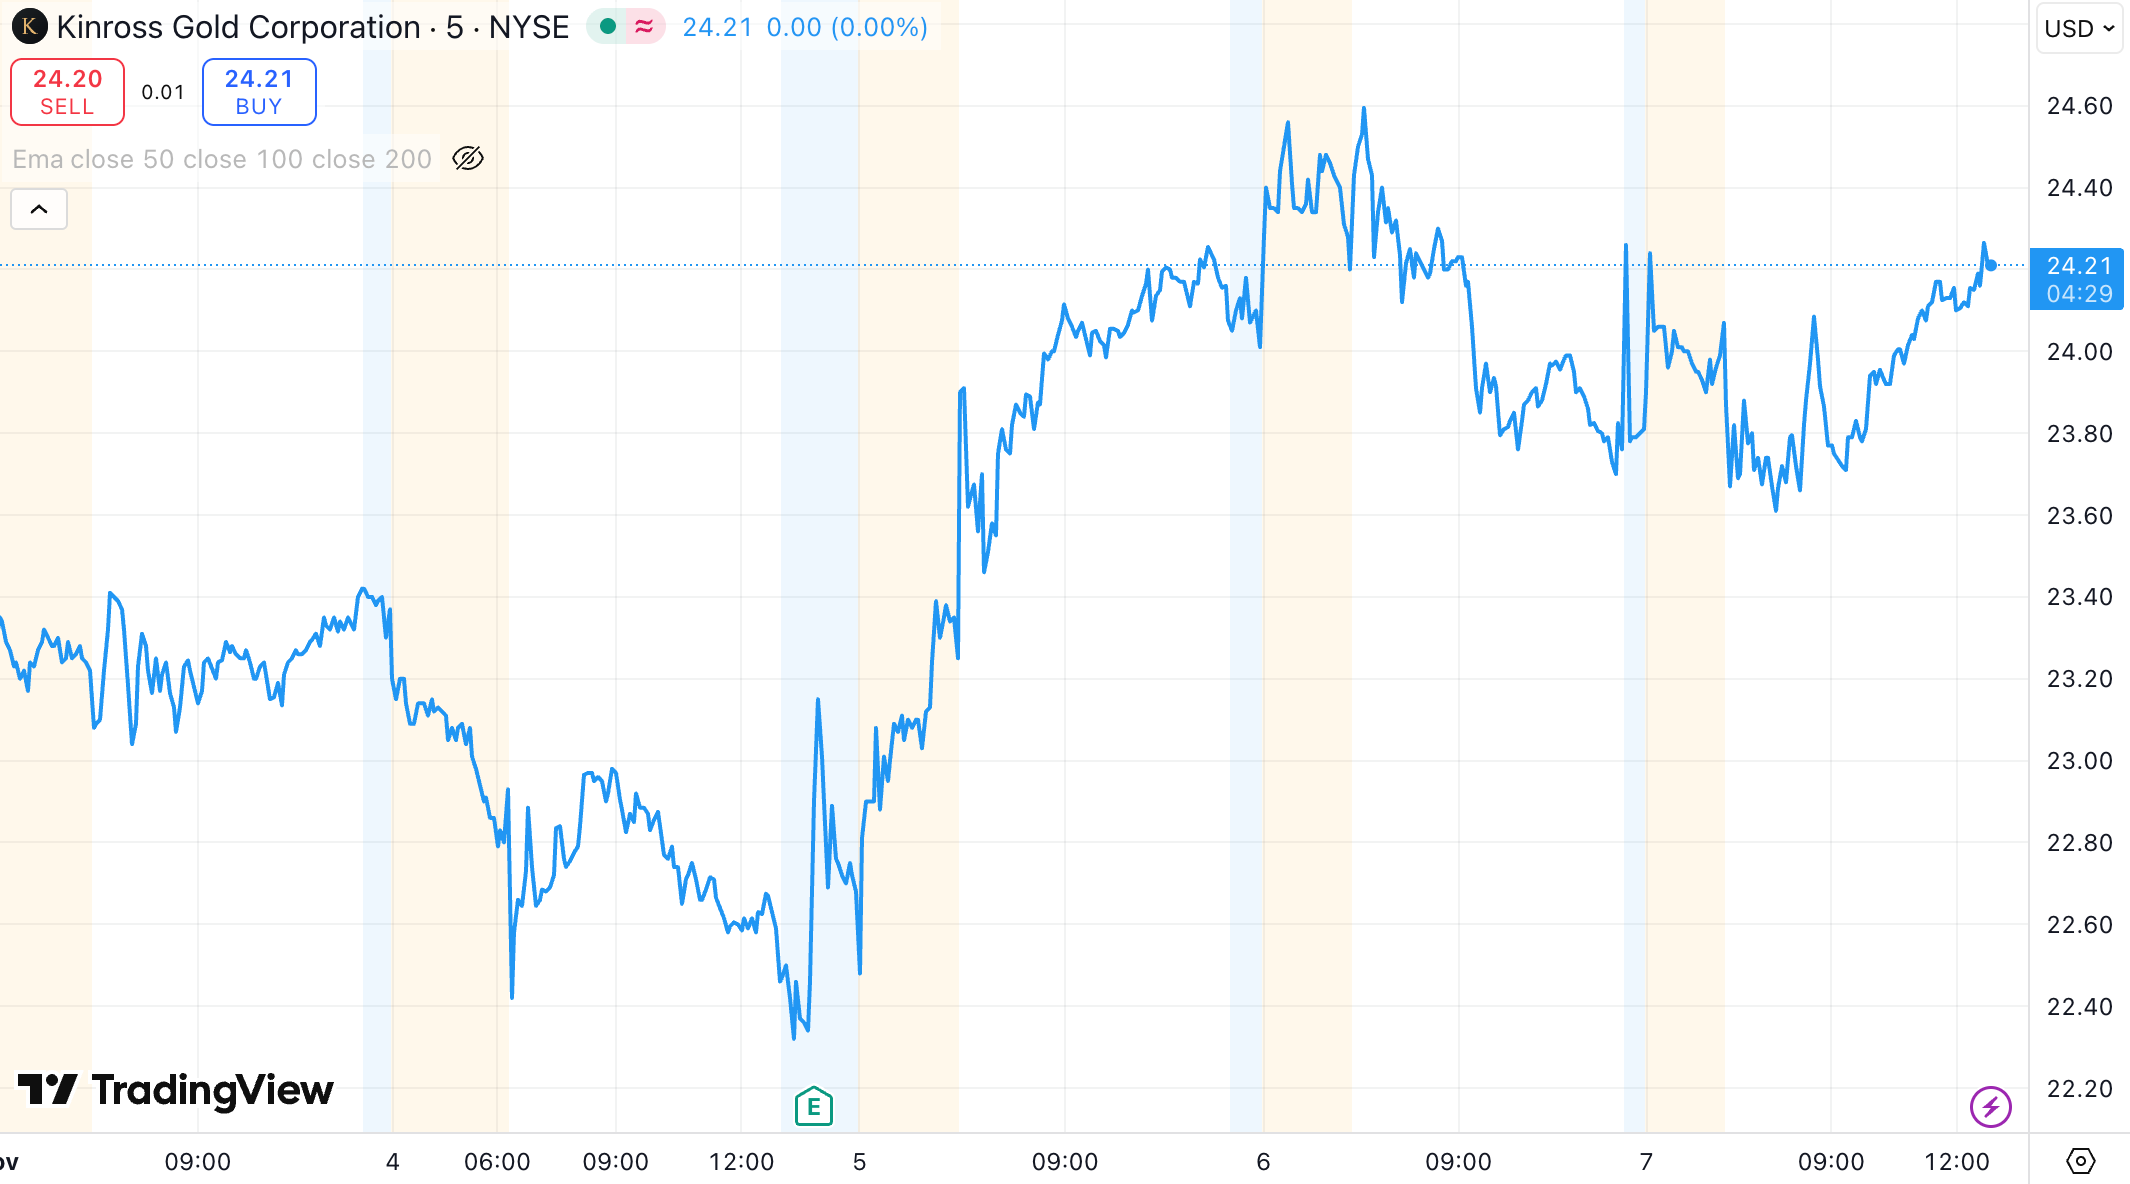
With gold holding its ground around $4,000, Kinross Gold closed the week up just over 4.2%, reflecting what happens when a quality producer delivers exactly what the market wants: record free cash flow, a strengthened balance sheet, and aggressive capital returns.
The catalyst came on Thursday when Kinross reported Q3 earnings. The company posted a record free cash flow of approximately $700 million, bringing year-to-date free cash flow to over $1.7 billion. Kinross achieved a net cash position of $485 million with roughly $1.7 billion in cash and $3.4 billion in total liquidity. S&P upgraded the company’s outlook from stable to positive.
But here’s what moved the stock: Kinross put that cash to work. The company increased its 2025 share buyback target by 20% to $600 million and raised its quarterly dividend by 17% to $0.14 per share annually. That’s approximately $750 million returning to shareholders in 2025. With margins expanding 54% year-over-year to $2,310 per ounce sold, Kinross is executing at exactly the right time.
Bottom line: This is what quality looks like in a gold bull market. Record cash flow, fortress balance sheet, aggressive shareholder returns. For those positioned in senior gold producers with clean execution, this is the setup that compounds.
Want more weekly insights like this? Subscribe and stay tuned for next week’s edition of the VRIC Media Newsletter.
Disclaimer: This content is for educational purposes only and is not financial advice. Do your own research and consider speaking with a licensed professional.